The various social media platforms are a key advertising tool for many pest managers. It makes sense then, to review the latest statistics, which show the usage patterns on the key platforms. The Digital 2025: Australia report provides a great summary of the latest social media performance data. Here are the key takeaways:
As of the start of 2025, there were 20.9 million active social media identities in Australia. On average, Australians spend 1 hours and 51 minutes per day on social media and have an average of 7.2 social media accounts!
This means businesses are missing a significant opportunity to get in front of their target customers, if they are not active on one or more of the social media platforms. However, the challenge is to determine which platform to utilise? Understanding which platform is best to reach your target customer is key, both in terms of number of users and their age profile, as well as effectiveness and cost of advertising.
It can be a challenge to get accurate figures for the number of users, as each platform also releases advertising reach figures, which is not necessarily the same thing as users. Furthermore, each platform may calculate their figures slightly differently.
In terms of users, Facebook was the most used social media platform with 77.7% of internet users over the age of 16 using Facebook. Instagram came in third with 65.2% of users, with TikTok fifth, on 44.1%. Two messaging Apps – Messenger and WhatsApp – came in a position two and four respectively.
In terms of advertising reach Figure 1 lists the annual figures in the Digital 2025 report.
Figure 1: Reported advertising reach on the main social media platforms
|
Platform |
Australian Ad Reach (millions) |
|
YouTube |
20.9 |
|
|
17.2 |
|
|
17 |
|
|
14.3 |
|
Snapchat |
8.27 |
|
TikTok |
8.01 |
|
5.39 |
|
| X |
5.25 |
If you consider YouTube more of a search engine than social media platform, then Facebook has the biggest reach. Although LinkedIn also has a big, claimed ad reach, users spend far less time on LinkedIn, and it tends to be more beneficial for B2B advertising.
Of course, the user number or reach figure does not provide information on how much time users spend on each platform. For example, users spend on average around 1.25 hrs a day on TikTok (the social media platform with the highest view time per day), three times more than the time spend on Instagram. Facebook users spend an average of 40 minutes a day.
As well as understanding how much time users spend on each platform it is important to consider the age profile of users and whether this matches with the age of your target customers. For example, the TikTok advertising audience is skewed to the younger groups – 35-44- and 18–34-year-olds. However, despite the fact Facebook has a larger number of older users, the largest Facebook user group was still the 25-34 age group.
You may be considering using social media to generate awareness and brand building, or for driving short term sales. It is therefore important to know how people are using these platforms.
The number one reason people use social media is to keep in touch with friends and family (58.2%). Finding inspiration for things to do and buy came in at number five (26.2%) and finding products to purchase came in at number nine (19.5%).
Comparing this with other online options for finding products, 37.6% of internet users discover brands, products and services through search engines, 34.3% by word of mouth, 33.6% by TV ads and 29.5% by social media. When searching for more information on brands and products, 62.5% use search engines, 36.8% brand and product websites directly, 36.5% consumer reviews and 33.6% social networks.
The key message here is that although the main reason for using social media channels is for infotainment and search is still number one when searching for services, the use of social media for shopping is not insignificant and growing.
However, it is also important to dig a bit deeper to understand how users are interacting with the content on the social media channels. Importantly, when it comes to driving traffic to websites, Facebook get the vast majority of the clicks arriving at websites from social media channels (around 65%). Instagram and Pinterest get around 12% each of the total clicks, with YouTube only getting 1.26% of clicks and TikTok was unspecified, grouped with the “others”.
Certainly, social media can be great for awareness and branding building and indeed, the use of Facebook for community engagement and local business discovery is a key activity for many businesses. This can be achieved through both organic and paid posts.
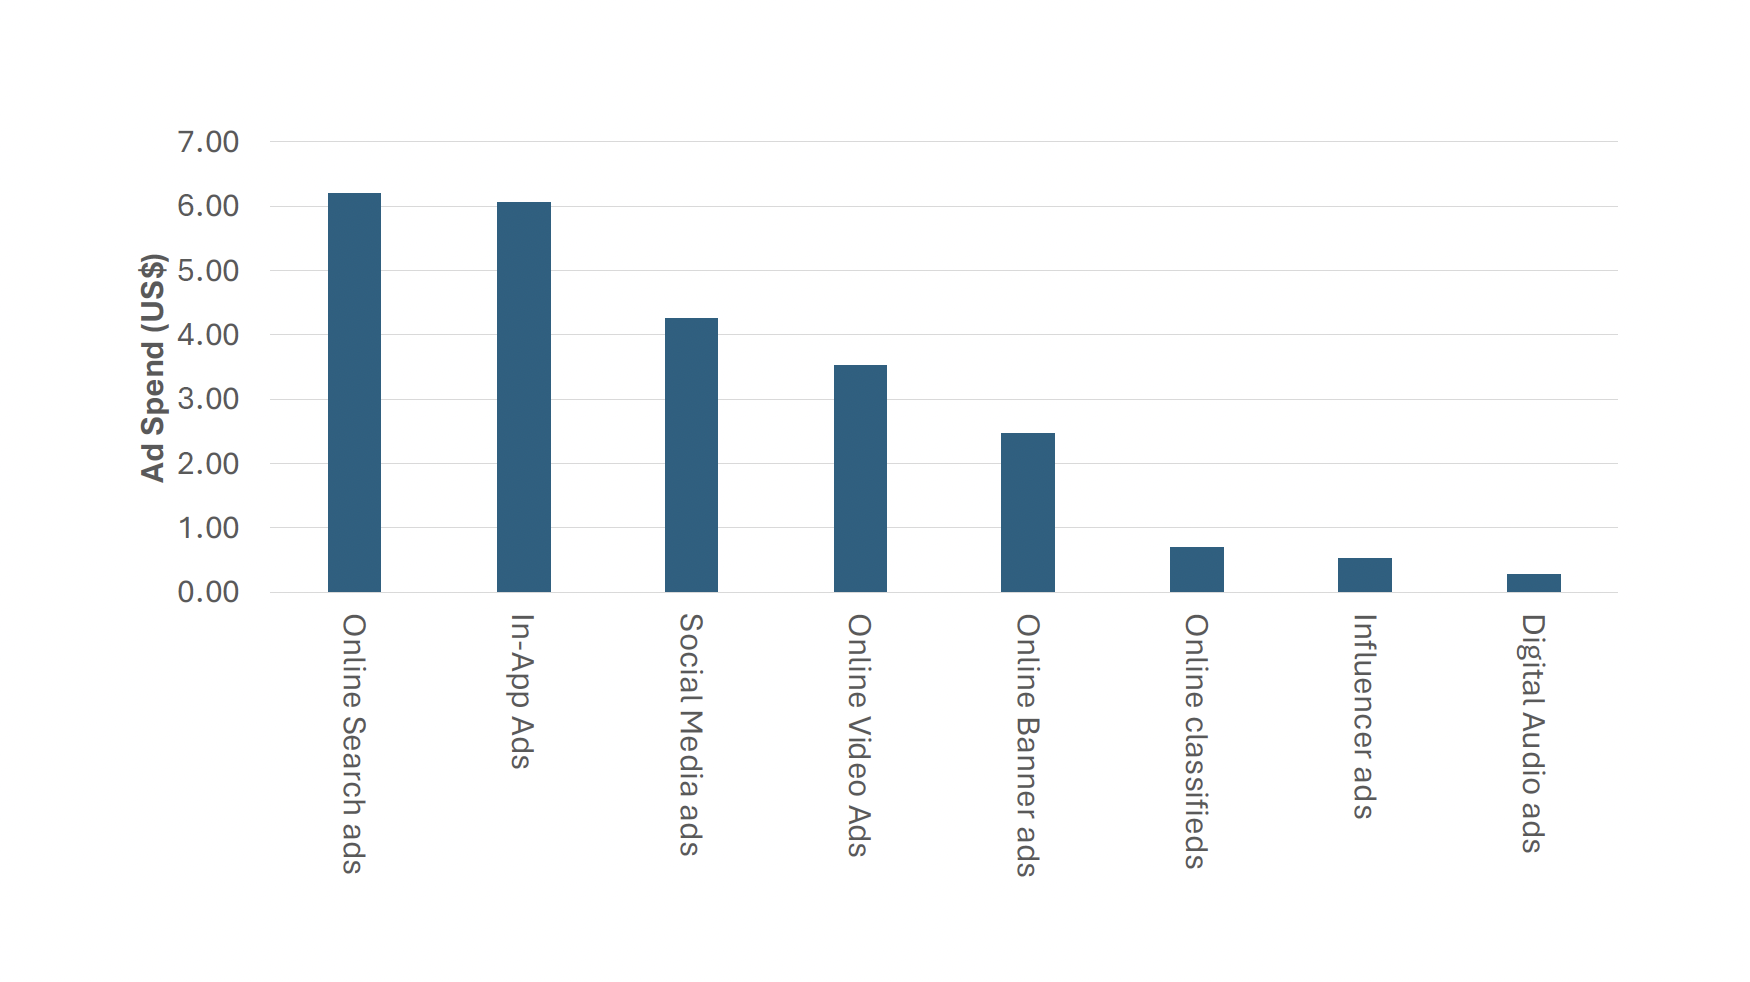
And businesses are spending big on social media advertising (Figure 2). Businesses still spend more on search ads (followed by in-app ads), but social media advertising in Australia was around US$4.25 billion in 2024, showing a 4.5% year on year increase. Indeed, 36.5% of respondents said they planned to increase their social media budgets in 2025 with only 6% saying they would decrease.
Figure 2: Digital Ad Spend Australia 2024
The bottom line is that most businesses should be active on Facebook at least, and probably YouTube and TikTok if you are producing video content (and you should be producing video content!). On top of organic posts, some level of advertising spend on social media should be considered.